Introduction
I don’t like most modern software. It feels like every codebase written in 2026 is badly optimized, messy and filled with unnecessary dependencies. In contrast to that, I really enjoy embedded development, especially when it’s done bare-metal.
It’s really cool to program a tiny microcontroller and see how far you can take its limited hardware. No external dependencies, no operating system. It’s just you, a C compiler and a dream.
A few months ago, I decided to buy myself some hardware kits. It’s been very entertaining to spend my lunch breaks at work building some simple prototypes. At some point, I thought it would be cool to create a project that would mix my interest in embedded development with my interest in graphics programming.
I ended up deciding it would be cool to write a 2D library for my OLED display modules in C. This blog post explains the technical details of how everything works.
The hardware
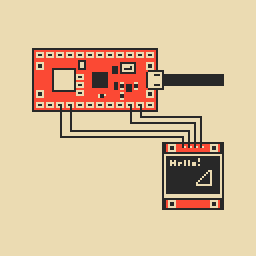
For this project I used:
- a Raspberry Pi Pico 2
- an SSD1306 OLED display
- an SH1107 OLED display
The Pico 2 is a microcontroller made by Raspberry Pi (a company better known for its mini computers). The C SDK for it is easy to set up and very well documented, making this microcontroller a pleasure to use (at least for me).
The SSD1306 and the SH1107 are generic 1-bit OLED displays that can be found on any hardware store online for cheap.
The library I wrote for this project will only work with this microcontroller and modules. However I think I wrote code in a way that will make it easy to expand it to more hardware components, if I ever feel like doing so, in the future.
Setting things up
Before the Pico 2 can send commands to the OLED displays and control them, a connection between them must be configured.
The SSD1306 and the SH1107 use a communication protocol named I2C. This is a very common, easy to implement protocol which requires only two lines: a data line (SDA) and a clock line (SCL).
I2C is based on a “Controller <-> Target” hierarchy. The Controller sends commands, while the Target receives, decodes and executes them. It’s possible for multiple Controllers and Targets to share the same SDA and SCL lines. This means it’s possible for a single microcontroller to control multiple display modules at once.

To represent the OLED displays in code, I created the following structure:
typedef struct {
    i2c_inst_t* i2c;          ///< i2c bus (i2c0 or i2c1)
    uint baudrate;            ///< communication speed, is usually 400 000
    uint gpio_sda;            ///< gpio for i2c data line
    uint gpio_scl;            ///< gpio for i2c clock line
    uint8_t address;          ///< OLED display address
    int width;
    int height;
    uint8_t* buf;
    display_type type;
} display;
The variables “i2c”, “baudrate”, “gpio_sda”, “gpio_scl” and “address” are used to configure the I2C connection for each display. The Pico C SDK provides an easy way to do this.
void init_i2c(display* display){
    i2c_init(display->i2c, display->baudrate);
    gpio_set_function(display->gpio_sda, GPIO_FUNC_I2C);
    gpio_set_function(display->gpio_scl, GPIO_FUNC_I2C);
    gpio_pull_up(display->gpio_sda);
    gpio_pull_up(display->gpio_scl);
}
After the connection between the Pico 2 and the OLED displays has been established, the Pico 2 can start sending commands to control them.
void send_cmd(display* display, uint8_t cmd){
    uint8_t buf[2] = {CONTROL_CMD, cmd};
    i2c_write_blocking(display->i2c, display->address, buf, 2, false);
}
Drawing a single point
Many people think lower-level graphics programming is very hard. Technically, these people are correct: modern APIs like Vulkan, DirectX12 or Metal do a lot of things under the hood to make sure your GPU hardware is used as efficiently as possible.
However, if all you want to do is use a display to render simple primitives (points, lines, shapes), and apply geometric transformations over those primitives or add some textures, then, you really only need to figure out one method: draw_point. Everything else is a solved problem.
The SSD1306 and the SH1107 both function in the same way: they store the value of each pixel in RAM. Each pixel occupies 1 bit. If that bit has its value set to zero, the pixel is turned off, if its value is set to one, the pixel is on. Both displays divide their pixels into “pages” and “columns”. A page is just a group of 8 rows. 1 byte is used to store the value for each [page,column] combination.

As seen before, the “display” struct stores the height and width of a display. In addition to that, it also has a “buf” variable. This buffer stores unsigned 8 bit integers and should have the size of display->width * display->height / 8, mimicking the memory inside the display.
typedef struct {
    ...
    int width;
    int height;
    uint8_t* buf;
    ...
} display;
Having this in mind, implementing draw_point becomes really simple. The method receives a point’s [x, y] coordinates inside a vector struct and uses simple bitshifts and logic operations to update the correct value inside the “display->buf” array.
void draw_point(display* display, vec2 point, bool on){
    int x = point.x;
    int y = point.y;
    if(y >= display->height || y < 0 || x >= display->width || x < 0) return;
    if(on){
        display->buf[display->width * (y >> 3) + x] |= (0b00000001 << (y & 7));
    }else{
        display->buf[display->width * (y >> 3) + x] &= (0b11111111 - (0b00000001 << (y & 7)));
    }
}
Drawing lines and shapes
Like I said, once draw_point has been implemented, draw_line and draw_shape are trivial problems to solve.
A line is just a group of points. By implementing Bresenham’s line algorithm, we can create a method which takes as input two points and draws a line from one to the other.
void draw_line(display* display, vec2 point0, vec2 point1, bool on){
    int dx = abs(point1.x - point0.x);
    int dy = abs(point1.y - point0.y);

    int sx = (point0.x < point1.x) ? 1 : -1;
    int sy = (point0.y < point1.y) ? 1 : -1;

    int err = dx - dy;
    int x = point0.x;
    int y = point0.y;

    do{
        draw_point(display, (vec2){x, y}, on);
        int e2 = 2 * err;
        if(e2 > -dy){
            err -= dy;
            x += sx;
        }
        if(e2 < dx){
            err += dx;
            y += sy;
        }
    } while (x != point1.x || y != point1.y);
}
A shape is just a group of lines. This algorithm is even easier to implement. It doesn’t even have a fancy name!
void draw_shape(display* display, vec2* points, uint size, bool on){
    for(int i = 0; i < size; i++){
        draw_line(display, points[i], points[(i+1)%size], on);
    }
}
Filling shapes with colors and textures
Drawing a shape is simple. Filling that shape with colors, and especially textures, is a bit more complicated.
In order to color the points inside a shape, we must first figure out an algorithm which tells us exactly which points are inside or outside a shape. For this library, I decided on using the following algorithm:
- Figure out the minimum and maximum x and y values for the shape.
- Using these values, create a bounding box around the shape.
- Iterate through each pixel in the bounding box and, if it’s inside the shape, color it.
There are many algorithms that can be used to determine if a point is inside of a shape. I spent a few minutes reading through a list, and I honestly recommend you do the same (it’s very interesting to study different ways of solving the same problem). In the end, I decided to use Barycentric coordinates to solve this problem.
Barycentric coordinates: Any 2D point, P, can be described as the sum of three points, A,B and C, multiplied by specific weights, wa, wb and wc. If all the weight values belong to the interval [0, 1], then P is located inside the triangle ABC.

The weights of barycentric coordinates are proportional to the areas of the sub-triangles PAB, PBC and PCA, so it’s pretty simple to calculate them.
float triangle_area_signed(vec2f p0, vec2f p1, vec2f p2){
    return 0.5 * ((p1.y-p0.y)*(p1.x+p0.x)+(p2.y-p1.y)*(p2.x+p1.x)+(p0.y-p2.y)*(p0.x+p2.x));
}
bool point_inside_shape(vec2 point, vec2* shape, uint size){
    vec2f pointf = {point.x, point.y};
    vec2f a = {shape[0].x, shape[0].y};
    for(int i = 1; i + 1 < size; i++){
        vec2f b = {shape[i].x, shape[i].y};
        vec2f c = {shape[i+1].x, shape[i+1].y};

        float abc = triangle_area_signed(a, b, c);
        float pbc = triangle_area_signed(pointf, b, c);
        float pca = triangle_area_signed(pointf, c, a);

        float wa = pbc / abc;
        float wb = pca / abc;
        float wc = 1.0 - (wa + wb);

        if(wa < 0.0 || wb < 0.0 || wc < 0.0) continue;

        return true;
    }
    return false;
}
The final function for drawing shapes and filling them with a color ended up looking like this:
void draw_shape_fill(display* display, vec2* points, uint size, bool on){
    int xmin = points[0].x;
    int xmax = points[0].x;
    int ymin = points[0].y;
    int ymax = points[0].y;

    for(uint i = 1; i < size; i++){
        xmin = MIN(xmin, points[i].x);
        xmax = MAX(xmax, points[i].x);
        ymin = MIN(ymin, points[i].y);
        ymax = MAX(ymax, points[i].y);
    }

    for(int y = ymin; y <= ymax; y++){
        for(int x = xmin; x <= xmax; x++){
            vec2 point = {x, y};
            if(point_inside_shape(point, points, size)){
                draw_point(display, (vec2){x, y}, on);
            }
        }
    }
}
The algorithm for applying a texture over a shape uses the same base logic as this one. But, instead of coloring shapes with a singular color, we sample colors from a texture.
In order to represent textures in code, I created a structure named “sprite”, which stores a texture’s width, height and sprite data. The sprite data is stored inside an array of unsigned 8 bit integers, which follows the same logic as the display buffer.
typedef struct {
    uint width;
    uint height;
    const uint8_t* data;
} sprite;
I “vibe-coded” a Python script which converts black and white .png files into data that can be used to create “sprite” structs.
A relation between the points of a shape and the pixels in a texture needs to be established, so we know which texture pixel to sample from when coloring a pixel inside a shape. This problem has already been solved by every major graphics API by using this thing called “UV coordinates”.

Each vertex in a shape will have a UV coordinate. This coordinate indicates which pixel from a texture should be sampled for that specific vertex. The UV coordinate for every other non-vertex point in the shape can be calculated using barycentric coordinates (which we were already calculating for each point anyways).
void draw_shape_fill_sprite(display* display, vec2* points, vec2f* tex, uint size, sprite* sprite, bool inverted) {
    int xmin = points[0].x;
    int xmax = points[0].x;
    int ymin = points[0].y;
    int ymax = points[0].y;

    for(uint i = 1; i < size; i++){
        xmin = MIN(xmin, points[i].x);
        xmax = MAX(xmax, points[i].x);
        ymin = MIN(ymin, points[i].y);
        ymax = MAX(ymax, points[i].y);
    }

    for(int y = ymin; y < ymax; y++){
        for(int x = xmin; x < xmax; x++){
            vec2f point = {x + 0.5f, y + 0.5f};
            vec2f a = {points[0].x, points[0].y};
            for(int i = 1; i + 1 < size; i++){
                vec2f b = {points[i].x, points[i].y};
                vec2f c = {points[i+1].x, points[i+1].y};;

                float abc = triangle_area_signed(a, b, c);
                float pbc = triangle_area_signed(point, b, c);
                float pca = triangle_area_signed(point, c, a);

                float wa = pbc / abc;
                float wb = pca / abc;
                float wc = 1.0 - (wa + wb);

                if(wa < 0.0 || wb < 0.0 || wc < 0.0) continue;

                float u = tex[0].x * wa + tex[i].x * wb + tex[i+1].x * wc;
                float v = tex[0].y * wa + tex[i].y * wb + tex[i+1].y * wc;

                int tx = (int) (u * sprite->width) % sprite->width;
                int ty = (int) (v * sprite->height) % sprite->height;

                int8_t byte = sprite->data[ty/8 * sprite->width + tx];
                draw_point(display, (vec2){x, y}, ((byte >> (7 - (ty & 7))) & 1) ^ inverted);
                break;
            }
        }
    }
}
The methods implemented for this library are actually similar in concept to the ones used in many low-level graphics APIs. I think that’s pretty cool. Math is pretty cool.
Moving shapes around
Drawing points, lines and shapes is cool. Applying textures to shapes is even cooler. But, to achieve maximum levels of coolness, it’s important that those shapes can move around the screen. This is what allows you to implement interactive applications such as video games.
To move a shape, we don’t move the entire shape (that would be very slow and inefficient), we just move its vertices. The math for the 3 core mathematical transformations, translation, rotation and scaling, is pretty simple. You’ve probably studied these formulas already if you had math in high school.
void translate_points(vec2* points, uint size, vec2 t){
    for(uint i = 0; i < size; i++){
        points[i].x += t.x;
        points[i].y += t.y;
    }
}
void scale_points(vec2* points, uint size, vec2f s, vec2 center){
    for(uint i = 0; i < size; i++){
        float dx = points[i].x - center.x;
        float dy = points[i].y - center.y;

        float sx = dx * s.x;
        float sy = dy * s.y;

        points[i].x = (int)round(center.x + sx);
        points[i].y = (int)round(center.y + sy);
    }
}
void rotate_points(vec2* points, uint size, float r, vec2 center)
{
    float c = cosf(r);
    float s = sinf(r);
    for (uint i = 0; i < size; i++)
    {
        float dx = points[i].x - center.x;
        float dy = points[i].y - center.y;

        float rx = c * dx - s * dy;
        float ry = s * dx + c * dy;

        points[i].x = (int)round(center.x + rx);
        points[i].y = (int)round(center.y + ry);
    }
}
Final notes
This is the first project I’ve actually managed to complete from beginning to end. To be completely honest, I am very proud of it. Building this very tiny monochromatic renderer has allowed me to learn a few of the basic mathematical concepts that make up modern graphics APIs, which I think is knowledge that will be very useful in the future.
Not only was this project useful for learning purposes, it will also have a practical use whenever I need to interact with an OLED screen for an embedded project. I love using my own tech over pre-existing libraries.
In the future I would like to revisit this project in order to achieve two goals:
- Implement a simple physics engine for OLED screens.
- Expand the library to support more display modules, and add support for multiple colors and some basic 3D features.
I have nothing more to say. Look at this little video of the library working :]